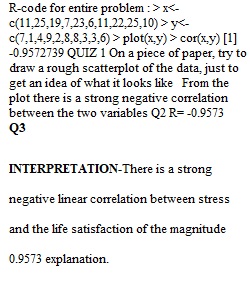
Q Yvette and Avy did a study on feelings of stress and life satisfaction. Participants completed a measure on how stressed they were feeling (on a 1 to 30 scale) and a measure of how satisfied they felt with their lives (measured on a 1 to 10 scale). The table below indicates the participants’ scores. Using the collected data, complete the following steps: 1. On a piece of paper, try to draw a rough scatterplot of the data, just to get an idea of what it looks like (15 points) 2. Calculate the correlation (r) between stress and life satisfaction (25 points) There are multiple ways to calculate a correlation coefficient r (that is, a standardized indicator of the relation between two variables). We can calculate the covariation between two variables (X and Y), and then adjust this by the standard deviation and sample size. Alternatively, we can calculate r from the Z scores: b) Using either method, calculate the correlation (r) between stress and lif OR use this freeCORRELATION COEFFICIENT Calculator (Links to an external site.) or any other calculator you find online (include link if you use a different tool) 3. Write a brief interpretation of this correlation, including the strength, direction, and an explanation of the effect. (25 points) 4. Can you say that being more stressed causes a lower level of life satisfaction? Why or why not? (10 points) PreviousNext
View Related Questions